* You are viewing Posts Tagged ‘Visualization’

Detail from the graphic.
Melissa Terras from the UCL Centre for Digital Humanities has, with the support of the UCLCDH, created a wonderful infographic of this exciting field. While not completely comprehensive, the visualization combines data from a wide variety of online sources across a range of measurable criteria, and is definitely worth a look. The infographic is available via the UCLCDH Flickr Stream or as a print download (pdf).
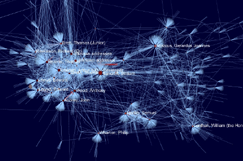
The CofK network at-a-glance.
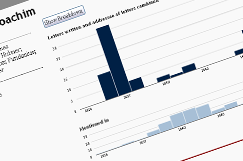
New interactive bar charts.
Further to our report on Scott Weingart‘s visit and presentation on Visualizing and Navigating the Republic of Letters, here’s a quick update on some of the fruits of his labours. During the week he was with us, Scott worked intensively with our developer community at BDLSS to implement some visual respresentations of the metadata assembled in our union catalogue of early modern correspondences, and the team produced some lovely deliverables within record time. The first are some revealing social network visualizations of the relationships between the 11,284 correspondents currently on the system, created with the Gephi graphics package. The second are some interactive, in-browser bar charts for display on person profile pages, displaying at-a-glance the number of letters sent, received, and mentioned in, created with the d3.js javascript library… and there’s more to come. At-a-glance representations such as these will radically improve the legibility and navigability of our records for end users, so a thank you to Scott for sharing his expertise with us. A public beta of the union catalogue will be available in the autumn.
Update: Preview some preliminary results
We are fortunate to have with us this week Scott Weingart, a former student of Robert A. Hatch and an up-and-coming visualization expert from Indiana University‘s Cyberinfrastructure for Network Science Center. Following on from a workshop at Mapping the Republic of Letters (Stanford) and a three-month stint at CKCC (Huygens Institute), Scott will be spending time with our union catalogue development team at BDLSS, raising awareness of the various techniques and technologies available for representing and visualizing large epistolary datasets. Scott kicked off his stay with a well-attended presentation on ‘Analyzing, Visualizing, and Navigating the Republic of Letters’ on Monday 11 July. In a two-part discussion, Scott provided a general introduction to the many uses and histories of visualizations, before describing in detail the various software packages and data formats necessary for implementation. Both of Scott’s talks can be watched again below; you can also ‘click along’ with his slides.
Part I: Introduction
Part II: Implementation
James Brown
July 13, 2011
Conferences and Workshops, Events, Project Updates
Tags: Databases, Digitization, Europe, Geography, Global, Networks, Spatial Theory, Visualization

We are pleased to announce that booking is now open for Intellectual Geography: Comparative Studies, 1550-1700, the second Project conference, which will take place at St Anne’s College, Oxford, on 5-7 September 2010. Organised by Howard Hotson, the event brings together case studies and digital projects exploring the roots of local, regional, and national intellectual traditions and networks within concrete features of political, economic, confessional, and physical geography. For provisional programme information, a steadily growing lists of speaker profiles and abstracts, and to book online, please visit the conference website. The deadline for registrations is Wednesay 31 August.
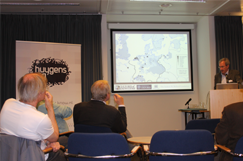
Project Director Howard Hotson opens our talk with some Hartlibian background.
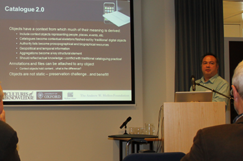
Our technical lead Neil Jefferies describes 'Catalogue 2.0'.
Last week provided us with another opportunity to share the Project, specifically its union catalogue and associated editorial tools, at the international conference Representing the Republic of Letters (The Hague, 30 June–1 July 2011). Organised by our partners and good friends CKCC in the congenial surroundings of the recently renamed Huygens ING, and held in conjunction with the Descartes Centre at Utrecht University, the event showcased the fascinating work being undertaken by various individuals and projects worldwide to represent early modern correspondence networks and their constituent components digitally and visually. General sessions devoted to funding and standards facilitated ongoing collaborative discussions between CofK, our hosts, and Mapping the Republic of Letters (Stanford), who also presented at the event.
James Brown
June 26, 2011
Events, Lectures, Project Updates
Tags: Databases, Eighteenth Century, Hans Sloane, History of Medicine, History of Science, Networks, Seventeenth Century, Visualization
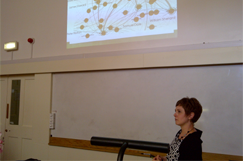
Dr Smith during her talk.

For the seventh and penultimate paper of our seminar series on Thursday 16 June, Dr Lisa Smith (University of Saskatchewan) described her recent efforts towards ‘Visualizing Hans Sloane’s Early Correspondence Networks’. Despite neglect in the historiographies of medicine and science, Smith described Sloane as a facilitator or ‘supermediator’ central to the activities of the early Royal Society as well as the lives of his patients, who corresponded voluminously despite his small number of formal publications. Indeed, Smith is in the process constructing a relational database of Sloane’s many letters – Sir Hans Sloane’s Correspondence Online – which she demonstrated during the talk, and which provided the raw data for the network visualizations. Emphasising that the resource is a work in progress (although an impressive 1,641 letters have been catalogued so far), Smith described the ‘back’ and ‘front’ ends of the catalogue – like our own digital resource, a sophisticated editorial interface sits beneath the search and browse functions – which allows users to explore and filter the Sloane corpus by a full range of standard epistolary metadata as well as a variety of medical themes and keywords, both contemporary and modern. Transcriptions are also being made available, while digital images of the original manuscripts are also in the pipeline. In the second half of her talk, Smith used visualizations of the data created with the recent Yifan Fu algorithm to explore several of the most interesting networks revealed by the correspondence; a surprisingly continental set of relationships, in which connections of patronage, marriage, and friendship loom large. Smith concluded by arguing that network visualizations derived from large datasets are vital in revealing intricacies and overlaps between groups of individuals which would not otherwise have been perceivable, and are of special value in highlighting clusters of relationships (or networks within networks) which can then be reconstructed in more detail. Seminars take place in the Faculty of History on George Street on Thursdays at 3pm. For future talks in the series, please see the seminar webpage.
 Podcast now available on the seminar page!


 Join
Join 