
New Visualizations for the Union Catalogue
Tags: Databases, Digitization, Networks, Union Catalogue, Visualization
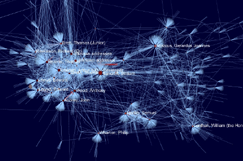
The CofK network at-a-glance.
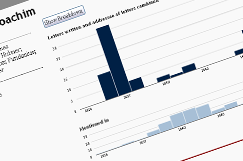
New interactive bar charts.
Further to our report on Scott Weingart‘s visit and presentation on Visualizing and Navigating the Republic of Letters, here’s a quick update on some of the fruits of his labours. During the week he was with us, Scott worked intensively with our developer community at BDLSS to implement some visual respresentations of the metadata assembled in our union catalogue of early modern correspondences, and the team produced some lovely deliverables within record time. The first are some revealing social network visualizations of the relationships between the 11,284 correspondents currently on the system, created with the Gephi graphics package. The second are some interactive, in-browser bar charts for display on person profile pages, displaying at-a-glance the number of letters sent, received, and mentioned in, created with the d3.js javascript library… and there’s more to come. At-a-glance representations such as these will radically improve the legibility and navigability of our records for end users, so a thank you to Scott for sharing his expertise with us. A public beta of the union catalogue will be available in the autumn.


 Join
Join 