
Digital Round Tables » 2011
Analyzing, Visualizing, and Navigating the Republic of Letters
Date: 11 July 2011
Venue: BDLSS, Osney Mead
Our third round table moved from metadata formats to the increasingly important theme of data visualization, and was led by Scott Weingart, a digital humanist, data scientist, and visualization expert from Indiana University’s Cyberinfrastructure for Network Science Centre.
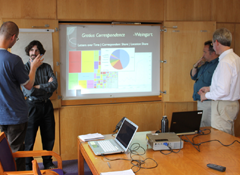
Scott in discussion
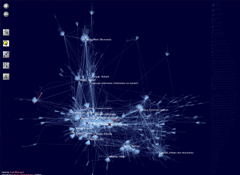
CofK network viz with Sci2
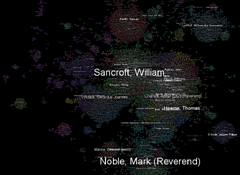
CofK network viz with Gephi
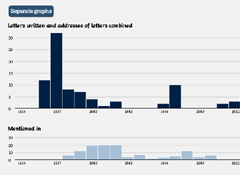
CofK dynamic bar charts with d3.js
At the outset of an extremely productive sprint week spent with our union catalogue design and development team at BDLSS, Scott gave a two-part presentation. The first half focused on the history of visualizations and considered the many interpretative and methodological issues attending their use for the representation and exploration big data, especially of an epistolary nature. The second half focused on implementation and deployment, including an introduction to data formats and an overview of the many open source software packages now available for data viz (such as Sci2, Gephi, and d3.js). This was followed by general discussion. Videos and slides from Scott’s talk are provided below; there are also write-ups of his time with us and what it yielded on our blog and on Scott’s own indispensable The Scottbot Irregular.
Analyzing, Visualizing, and Navigating the Republic of Letters Part I: Introduction
Analyzing, Visualizing, and Navigating the Republic of Letters Part II: Implementation
Analyzing, Visualizing, and Navigating the Republic of Letters: Slides


 Join
Join 